Reviewed September 24, 2026 against source v1.7.41. Features and fixes are labeled by version. Check release availability.
Build a one-to-six-view display
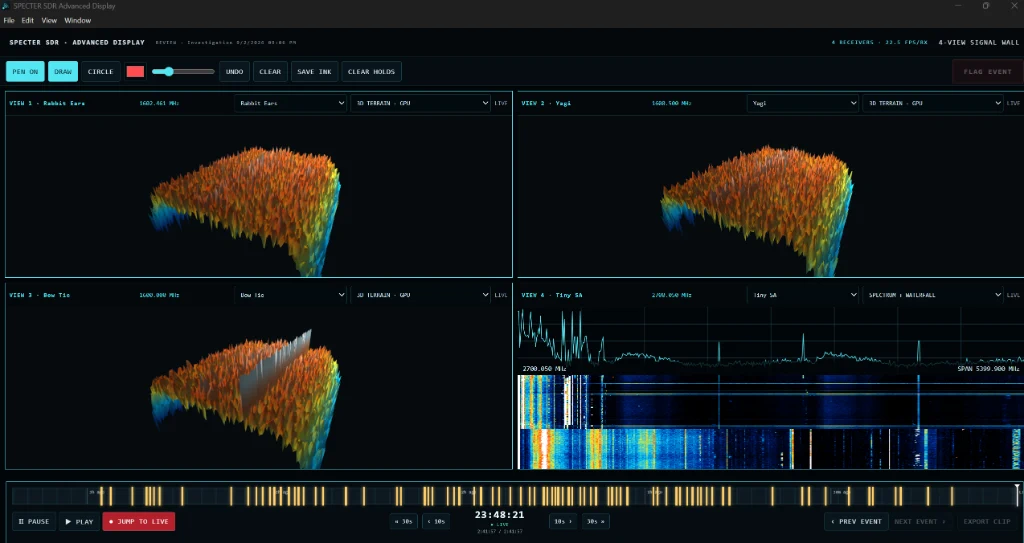
Open ADVANCED DISPLAY, choose a receiver in each tile, then assign an independent visualization. A tile can follow the live workspace or remain tied to its selected radio. The common timeline keeps all active views aligned during pause, playback, event navigation, and return to live.
- Open Advanced Display from the command bar.
- Select a layout with one to six tiles.
- Choose a receiver and visualization for each tile.
- Use PAUSE, PLAY, fixed jump controls, or JUMP TO LIVE across the shared timeline.
Available visualizers
| View | Best for |
|---|---|
| Spectrum and Waterfall | Exact frequency, level, bandwidth, and conventional scrolling history. |
| Persistence | Accumulated signal density, intermittent emitters, and noise-floor variation. |
| 3D Receiver Spectrum | Interactive depth-based inspection of peaks and neighboring energy. |
| 3D Waterfall History | Frequency change, drift, repetition, and bandwidth over time. |
| Research 3D Terrain | Orbiting accumulated RF structure with palette, grid, accent, and background controls. |
| Spectrum Tunnel | A forward-moving view through the same measured spectral history. |
| Band Occupancy | Per-bin duty cycle relative to the receiver's measured floor. |
| Direction Compass | Relative-amplitude comparison across bearing-assigned receivers. |
| IQ Constellation | Complex baseband structure, noise, clipping, and quantization. |
GPU and fallback behavior
3D views prefer WebGL2. When Chromium exposes software rendering or blocks a usable GPU context, SPECTER automatically uses its interactive Canvas2D fallback instead of leaving a black tile. Measured FPS appears in the display header.
Annotation and export
Use pen, circle, and arrow tools to mark a live or paused view. Choose color and size, undo or clear marks, save ink, and export a PNG for a report or field note.
Operate the workstation and Advanced Display together
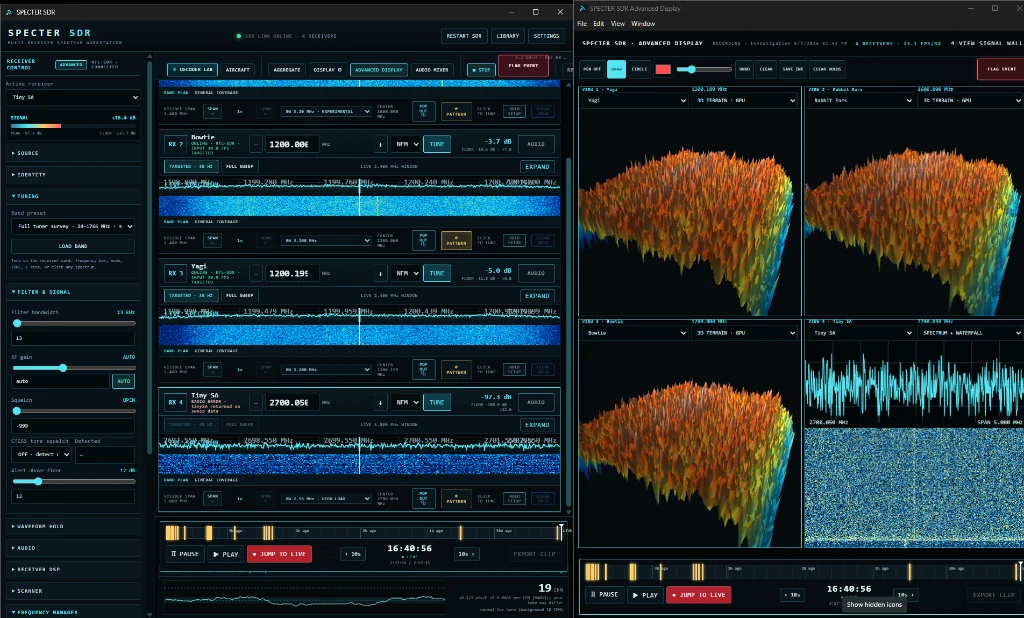
The primary workstation can keep receiver controls, stacked traces, and the synchronized session timeline visible while Advanced Display carries independent analysis tiles on the same or a second screen. This four-tile example includes three radio views and a TinySA spectrum-only trace.
Mixed radio and instrument layouts
The main workspace's v1.7.41 ordering puts radios first, spectrum analyzers next, and the radiation strip last. This does not change Advanced Display's one-to-six-tile layouts or receiver assignments. TinySA updates arrive once per completed sweep, so a wide range can legitimately update much more slowly than a radio FFT.
Real-product screenshots may show an earlier arrangement. Use the controls and version notes for the installed build.